Your pocket data scientist. NEXSPC breaks the boundary between 'data collection' and 'data analysis'. Traditionally, engineers export data to Excel or Minitab—time-consuming and error-prone. We embed a mathematical statistics engine directly into the kernel. Whether in a meeting room or on the production floor, simply open a browser to access professional tools covering Regression, Hypothesis Testing, and ANOVA. Making data-driven decisions as simple as browsing the web.
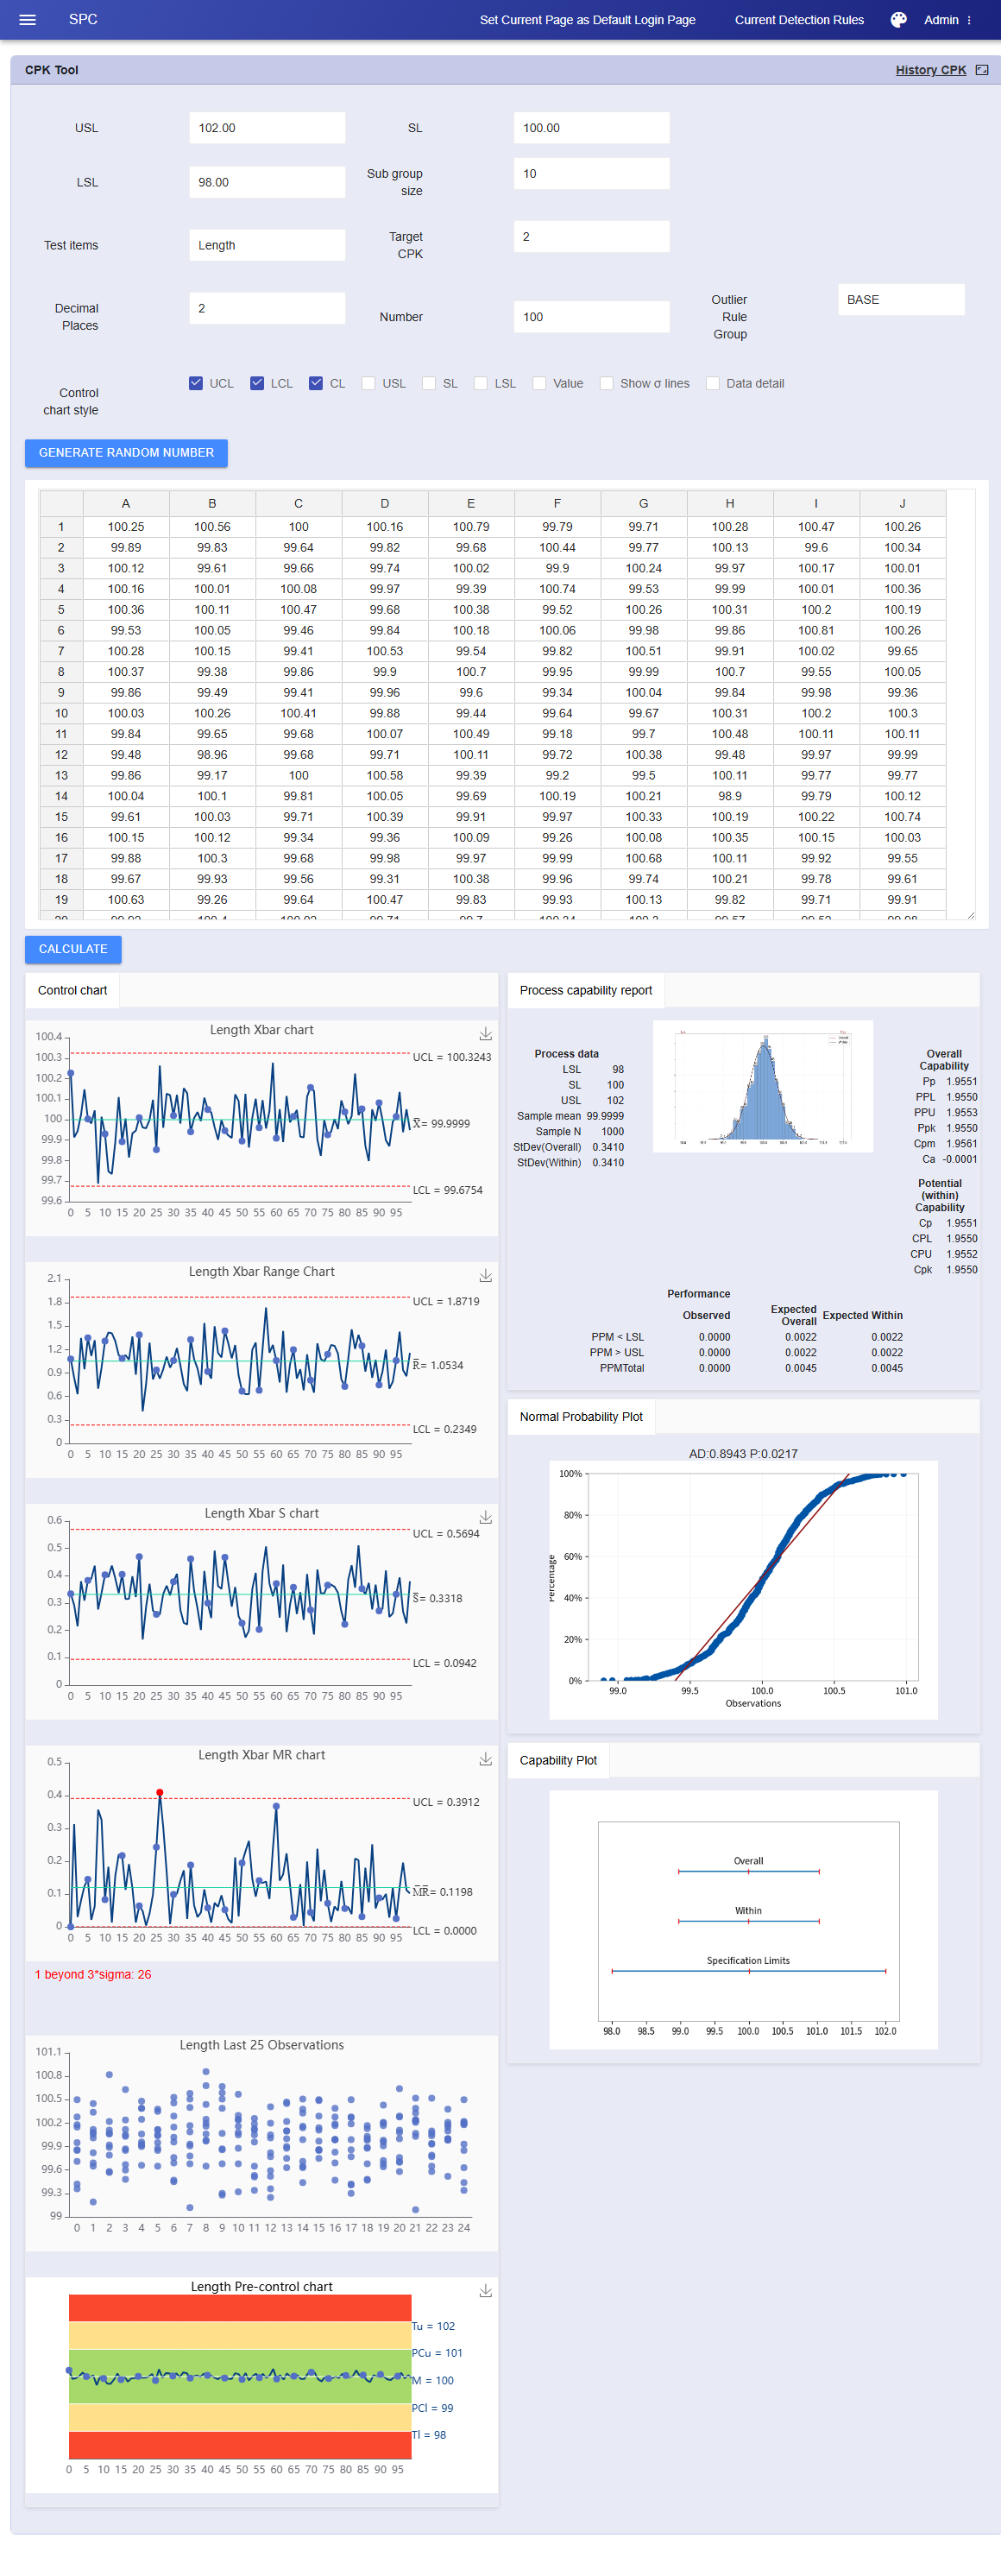
CPK/PPK Simulation Tool
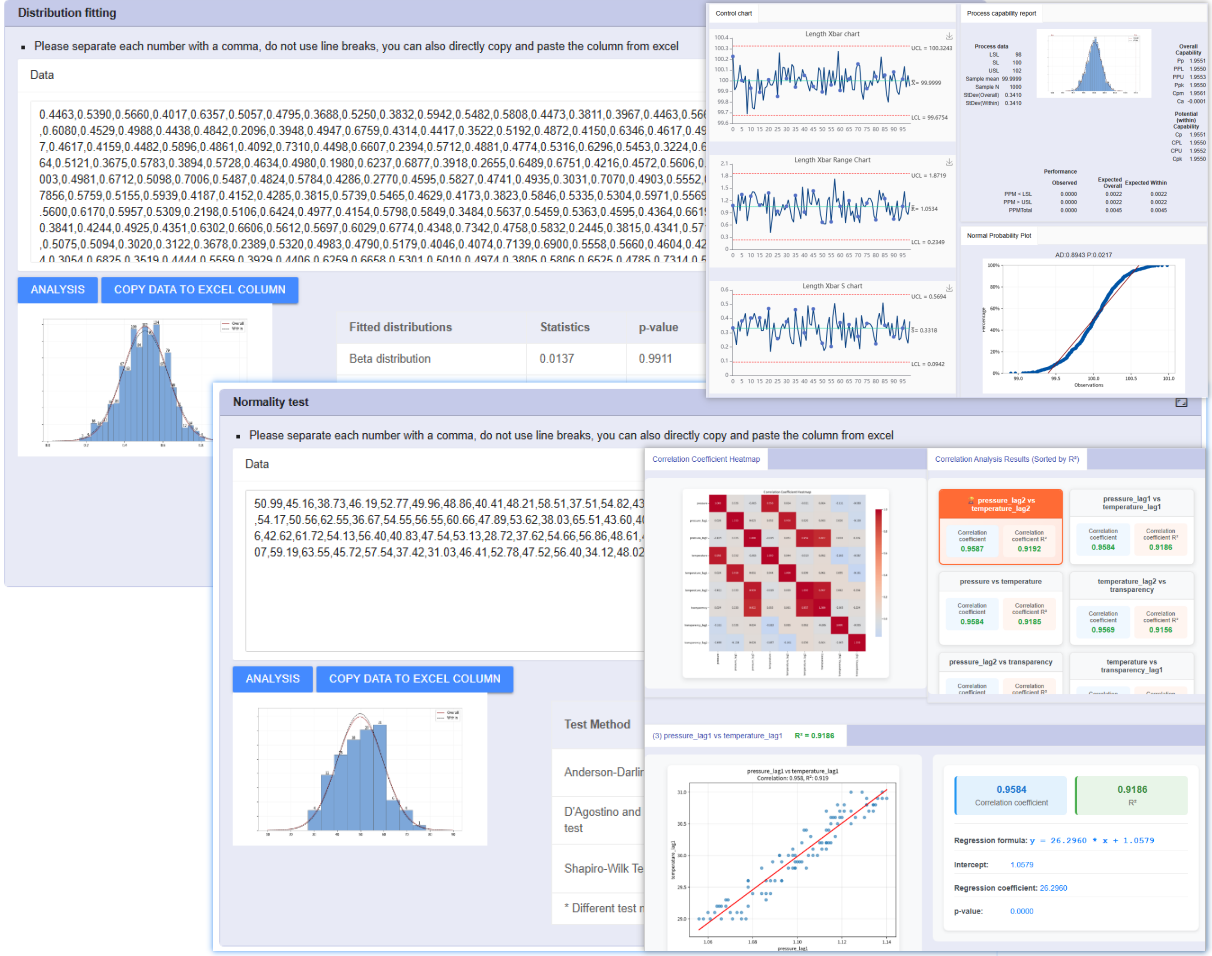
Have Excel data but don't want to set up projects or configure complex systems? Just want an immediate professional SPC report? Simply copy and paste one or more columns of data (with or without subgroups) from Excel directly into the input box. The system intelligently recognizes the format and generates a deep SPC analysis report.
Generates Control Charts, Histograms, Normality Tests, Process Capability Plots, and Rainbow Charts in one go.
Individual Data: Auto-outputs I-MR Charts, Last 25 Observations, and Capability Analysis.
Subgroup Data: Auto-outputs Xbar-R / Xbar-S Charts.
This 'Copy-Analyze' mode saves 90% of operation time, with chart richness far surpassing traditional Minitab 6-in-1 reports.
Need teaching data? Or need to verify 'what the control chart looks like when CPK=1.67'?
Industry-first reverse data generation engine. Stop passively analyzing data; start actively defining its shape.
Freely specify Spec Limits (USL/LSL/Target), Subgroup Size, Data Points, and Decimal Places.
Simply input your target CPK (e.g., 1.33 or 2.0), and the algorithm automatically generates a set of random normal distribution data matching that capability level.
If the generated graph is unsatisfactory (e.g., you want to see more outliers), simply click 'Regenerate' until you get the perfect simulation data.
Supports one-click export to Excel for both measured and simulated data. The file includes raw data details, analysis conclusions, and charts, facilitating secondary editing or archiving as formal Quality System Documents.
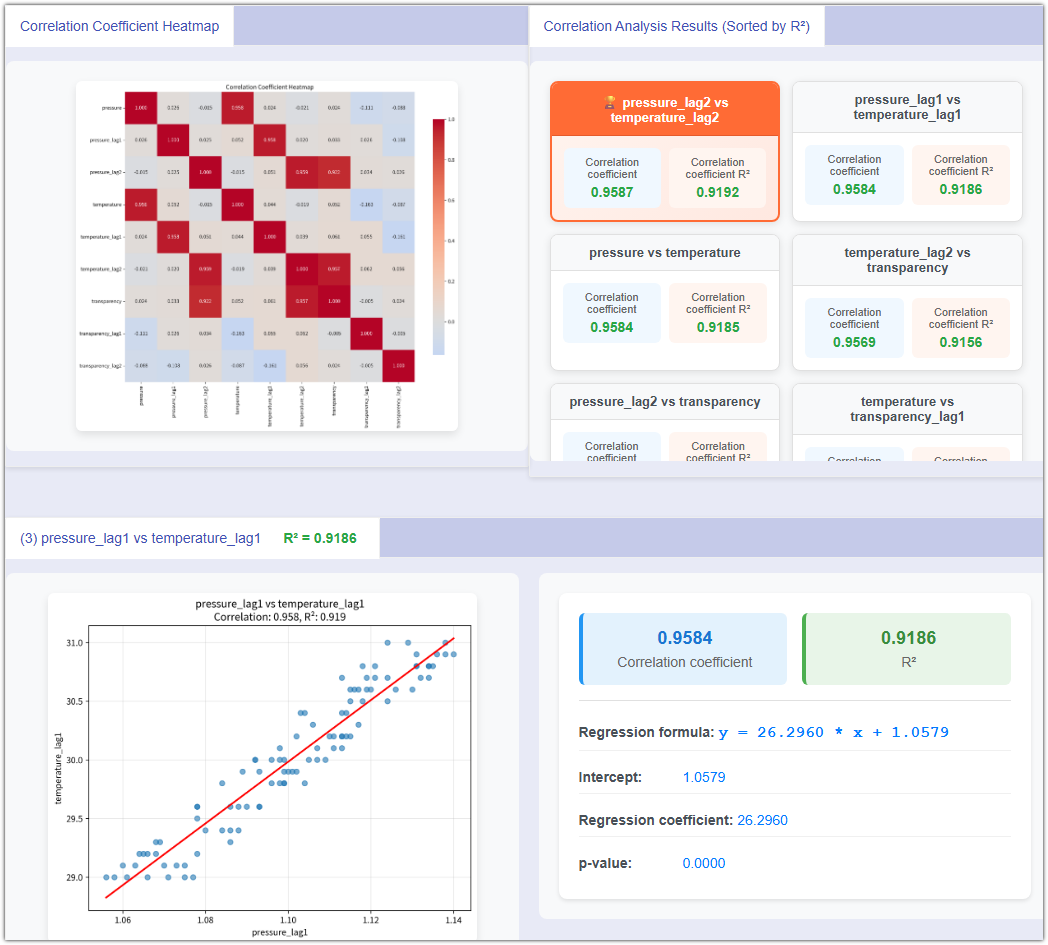
Regression & Correlation Analysis
Move from 'intuition' to 'quantification' and pinpoint the root cause of quality issues. When yield fluctuates, don't just look at results—find the cause. NEXSPC provides a powerful multi-dimensional correlation mining engine. Unlike traditional tools requiring tedious data export and cleaning, our system calls the database directly. It features an exclusive Auto-Lag algorithm to precisely lock onto hidden relationships masked by 'time delays' between complex process parameters (e.g., temperature, pressure) and quality characteristics (e.g., dimensions, hardness).
Goodbye to the 'Export-Clean-Import' nightmare. No need to organize Excel sheets. Simply select any number of existing inspection items from the menu, and the system instantly captures and aligns historical data for analysis. Zero-barrier data flow makes analysis as natural as breathing.
The advanced tech to solve 'Process Latency'. Often, a temperature rise doesn't immediately cause a hardness drop—it lags by 2 hours. Traditional tools miss this. NEXSPC supports setting Lag/Delay cycles. It automatically iterates calculations (T-1, T-2... T-N) to find the time gap with the highest Correlation Coefficient (R), revealing exactly when 'current adjustments' impact 'future quality'.
Automatically plots correlation coefficient heatmaps for variables (including lagged variables), visually presenting correlations.
Auto-calculates Regression Equation, R-Squared, and P-Value. Tells you in rigorous statistical language whether the 'causality' between variables is statistically significant.
History Trend Analysis Engine
How to quickly track annual quality changes for 10 items? Traditionally, it's a nightmare: export massive data, manually split by month, calculate CPK individually, record results, and plot charts. High workload, error-prone, and unsustainable. NEXSPC features a powerful Time-Series Slicing Engine, compressing days of work into seconds. Just define the cycle, and the system automatically cleans, splits, and aggregates metrics. Long-term stability analysis becomes as natural as breathing.
Scenario: Comparing Q1 vs Q2 quality, or viewing monthly CPK trends for key dimensions. NEXSPC eliminates manual data processing bottlenecks. No need to export to Excel for tedious monthly/weekly splitting, and no repetitive analysis runs in Minitab.
Automated Data Aggregation: As long as data is in the system, spanning one year or three, it grabs it instantly.
Multi-Project Parallel Analysis: Supports selecting multiple Key Product Characteristics (KPC) simultaneously. Run batch historical analysis, solving the 'too many items' problem.
Scenario: Customize analysis granularity for different management levels. Generate reports quickly via a minimalist configuration wizard.
Select Items: Check one or more inspection items you care about.
Define Range: Set start and end times (e.g., Jan 1, 2026 to Dec 31, 2026).
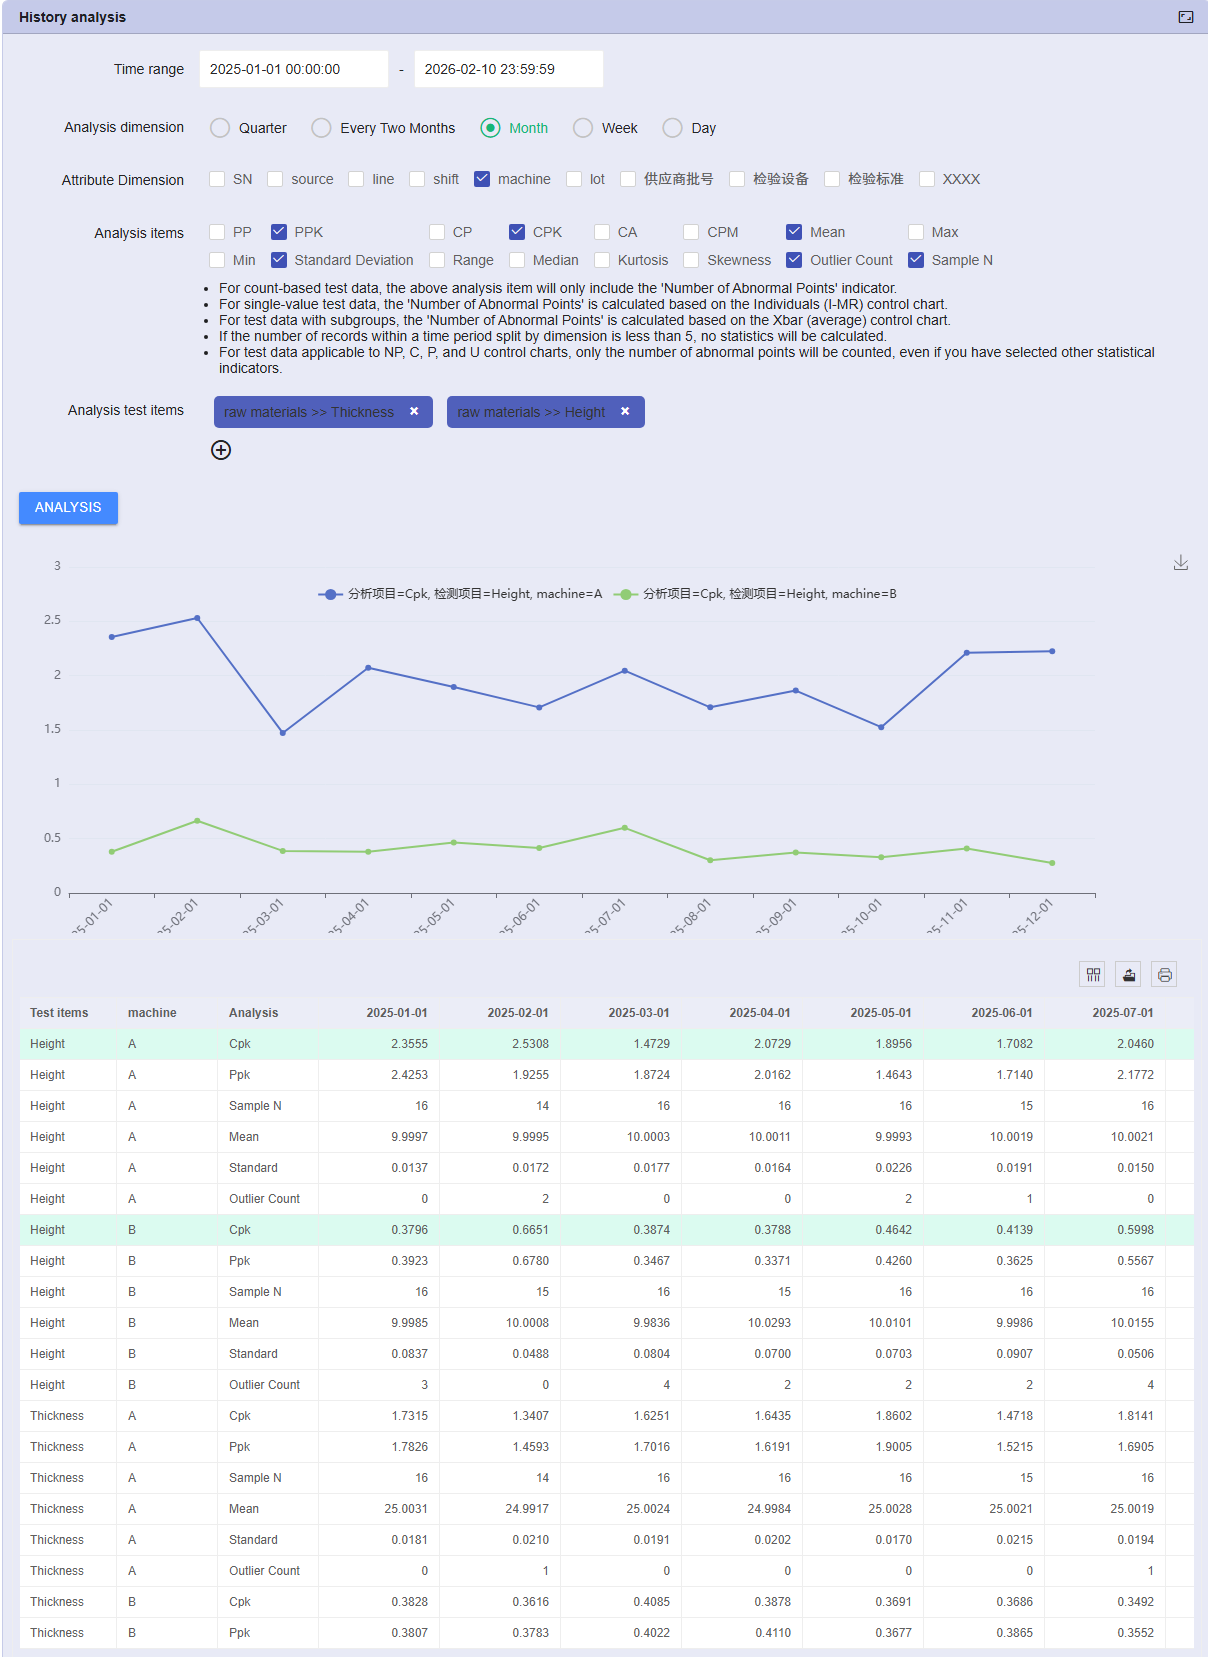
Slice Cycle: Choose data slicing granularity. Supports auto-splitting by Quarter, Bi-month, Month, Week, or Day.
Pick Indicators: Freely combine KPIs like PPK, CPK, Ca (Capability Index), Outliers, Mean, StdDev, etc.
Scenario: Need both concrete numerical reports and intuitive trend line charts for leadership presentations.
Upon Analysis Completion: The system instantly generates a multi-dimensional quality history statistics table.
Structured Reporting: The table details metrics like CPK values and Outlier counts for each period (e.g., Jan, Feb...), clearly showing quality evolution over time.
Online Trend Plotting: No need to screenshot for PPT. Select rows (e.g., 'Mean' or 'CPK') directly in the web table to instantly generate dynamic trend line charts. Intuitively see: Which month had the most variation? Which week did the mean drift?
Scenario: Use analysis results to drive the PDCA cycle or conduct deeper secondary mining.
One-Click Excel Export: While online plotting is available, we support exporting the generated statistics table to Excel for personalized formatting or archiving.
Liberate Productivity: Liberate engineers from low-value 'table making' to focus on the reasons behind the data. Make 'Quarterly Quality Reviews' or 'Annual Process Capability Summaries' a starting point for continuous improvement, not a burden.
Hypothesis Testing / T-Tests
Prove 'improvement' with data, not luck. In the PDCA cycle, the 'Check' phase is vital. NEXSPC offers full-scenario T-Test tools to scientifically compare pre- and post-improvement differences.
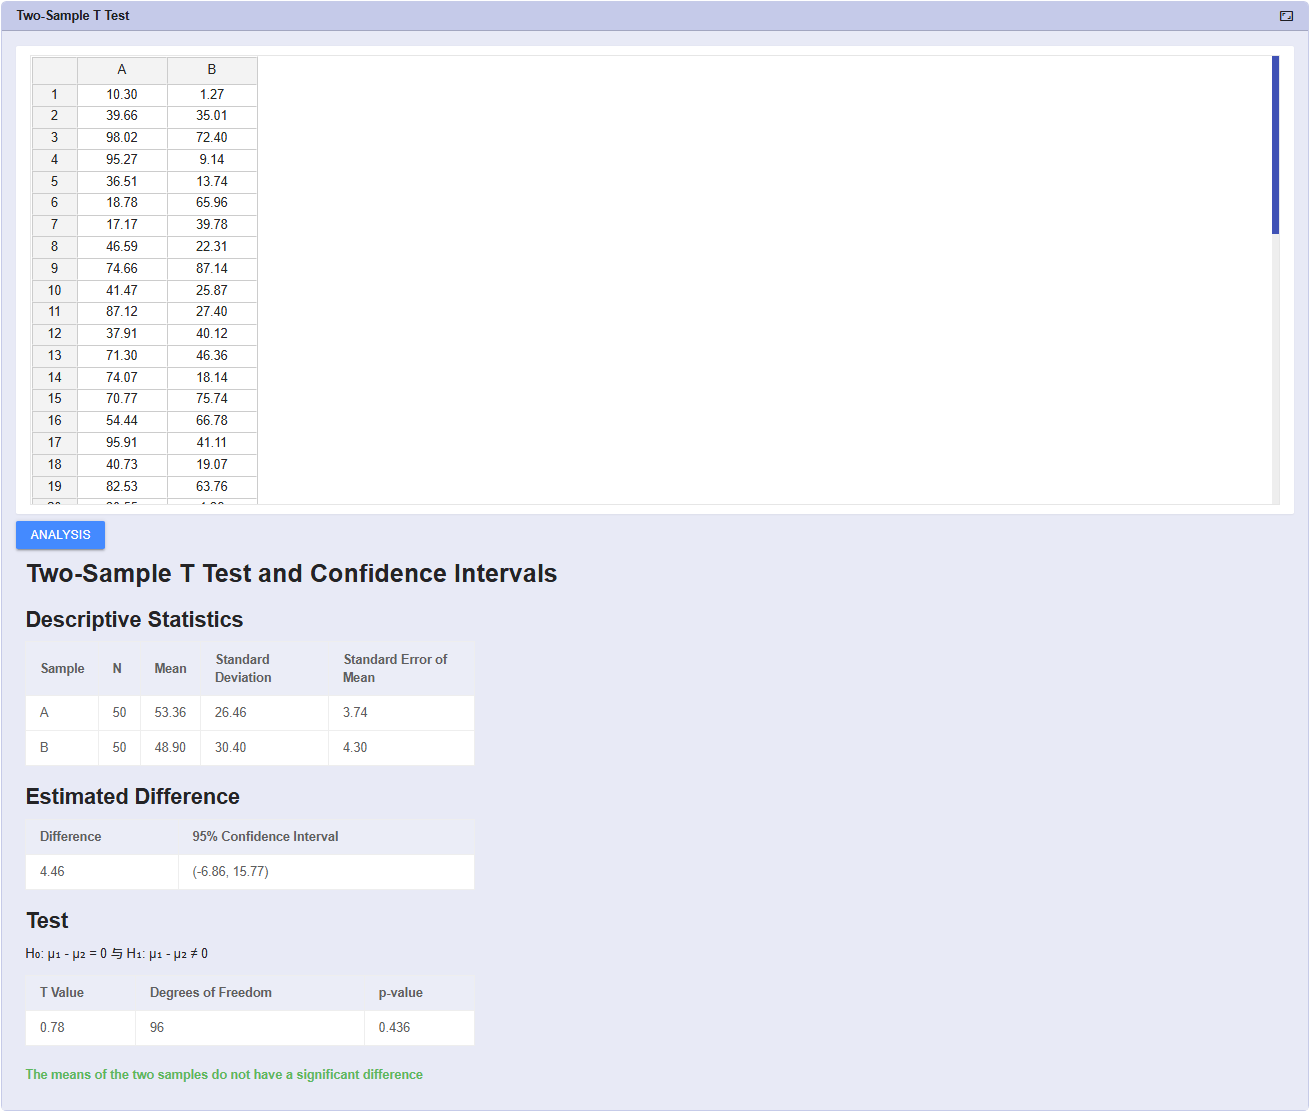
Supports One-Sample T-Test (verify mean shift) and Two-Sample T-Test (compare Machine A vs B, or Before vs After).
Automatically outputs Confidence Interval plots and Box Plots. Clearly informs if a significant difference exists, eliminating 'False Improvements'.
Distribution Fitting
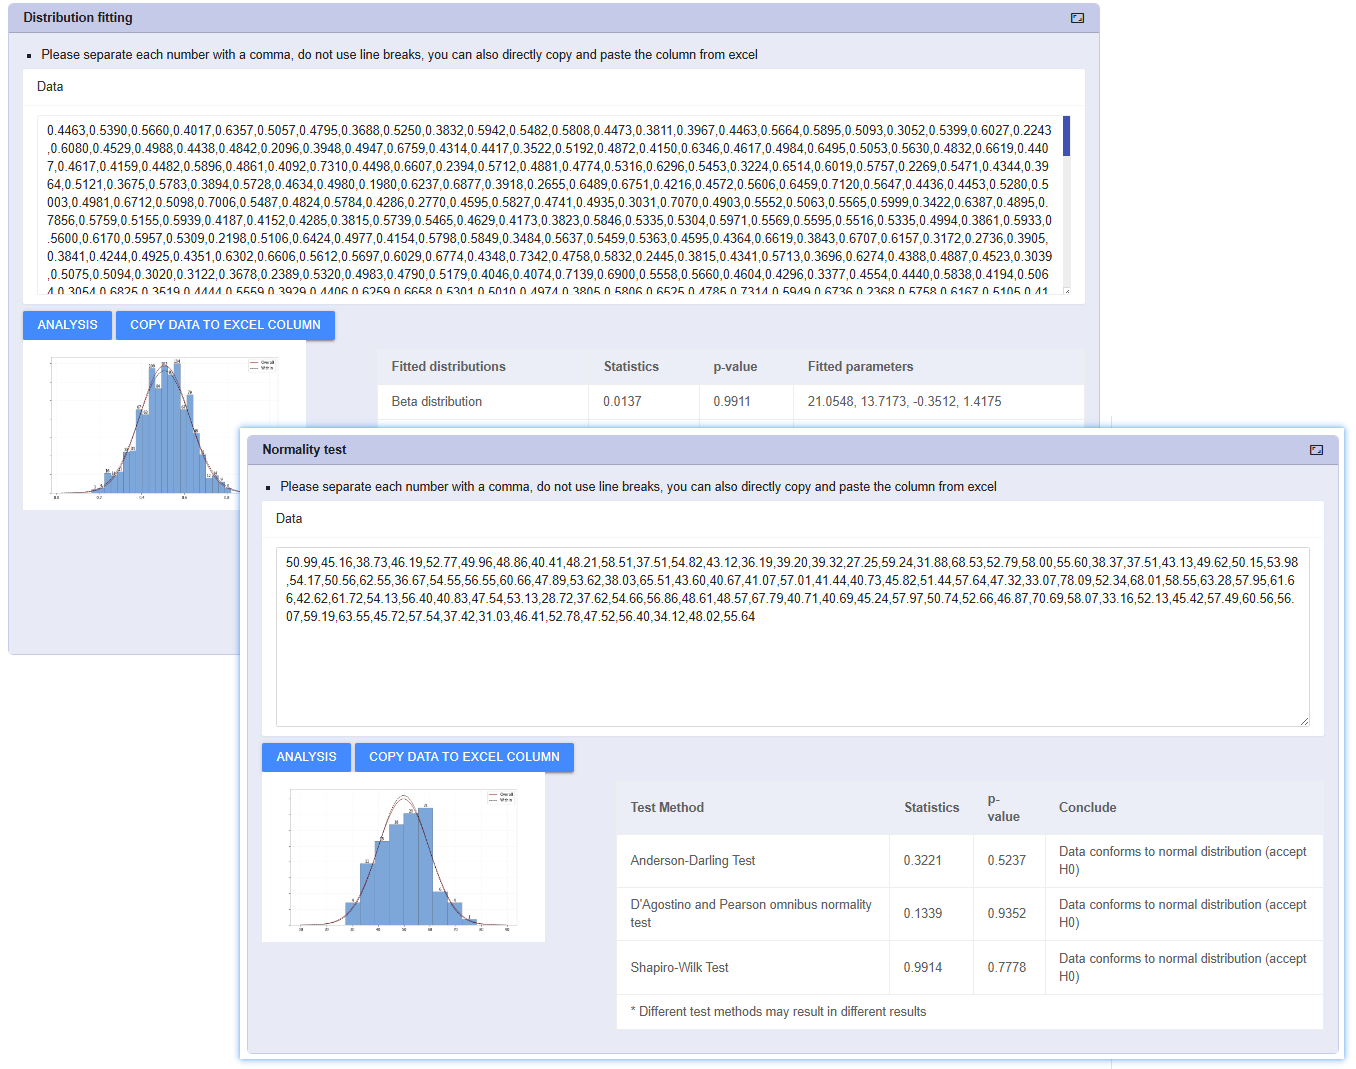
Reflect the real world and accurately assess non-normal data. Not all data follows a perfect normal distribution. For skewed data like lifetime testing, flatness, and impurity content, forcing CPK formulas leads to serious misjudgments.
Built-in Weibull, Log-normal, Exponential models. Auto-runs Anderson-Darling tests to recommend the best-fitting distribution curve.
Recalculates accurate Ppk indices based on the best-fit model, ensuring analysis accuracy in complex industries like semiconductor and chemical.
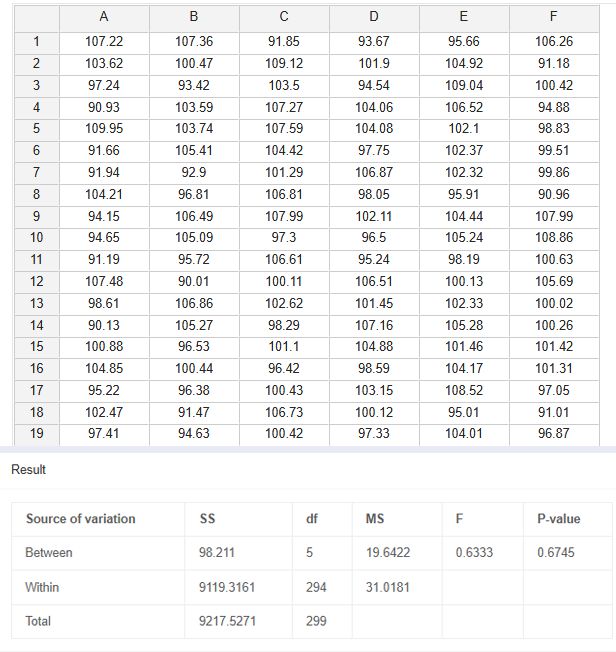
ANOVA & F-Test
Peel back the layers and isolate sources of variation amidst multiple interferences. When quality factors exceed two (e.g., comparing 3 shifts or 4 molds), simple T-Tests fall short.
Quickly identify significant mean differences across multiple groups. Generates Main Effects Plots for means.
Before comparing means, verify if the fluctuation amplitude (variance) of two datasets is consistent. Critical for assessing equipment precision stability.